Profiling models
Understand on-device profiling results.
When you profile a model through Embedl Hub, the compiled model is deployed to a real device and measured for latency, memory usage, and per-layer performance. This guide explains how the process works and how to read the results. For step-by-step instructions on creating a profiling run, see the quickstart.


How it works
When you profile a model using a cloud provider (such as qai-hub or aws),
the following happens:
- The compiled model is uploaded to the cloud.
- A target device is provisioned (the job is queued if all devices are busy).
- The model is transferred to the target device.
- The model is profiled using the target runtime, measuring various performance metrics.
- Results are made available on the run details page.
Reading the results
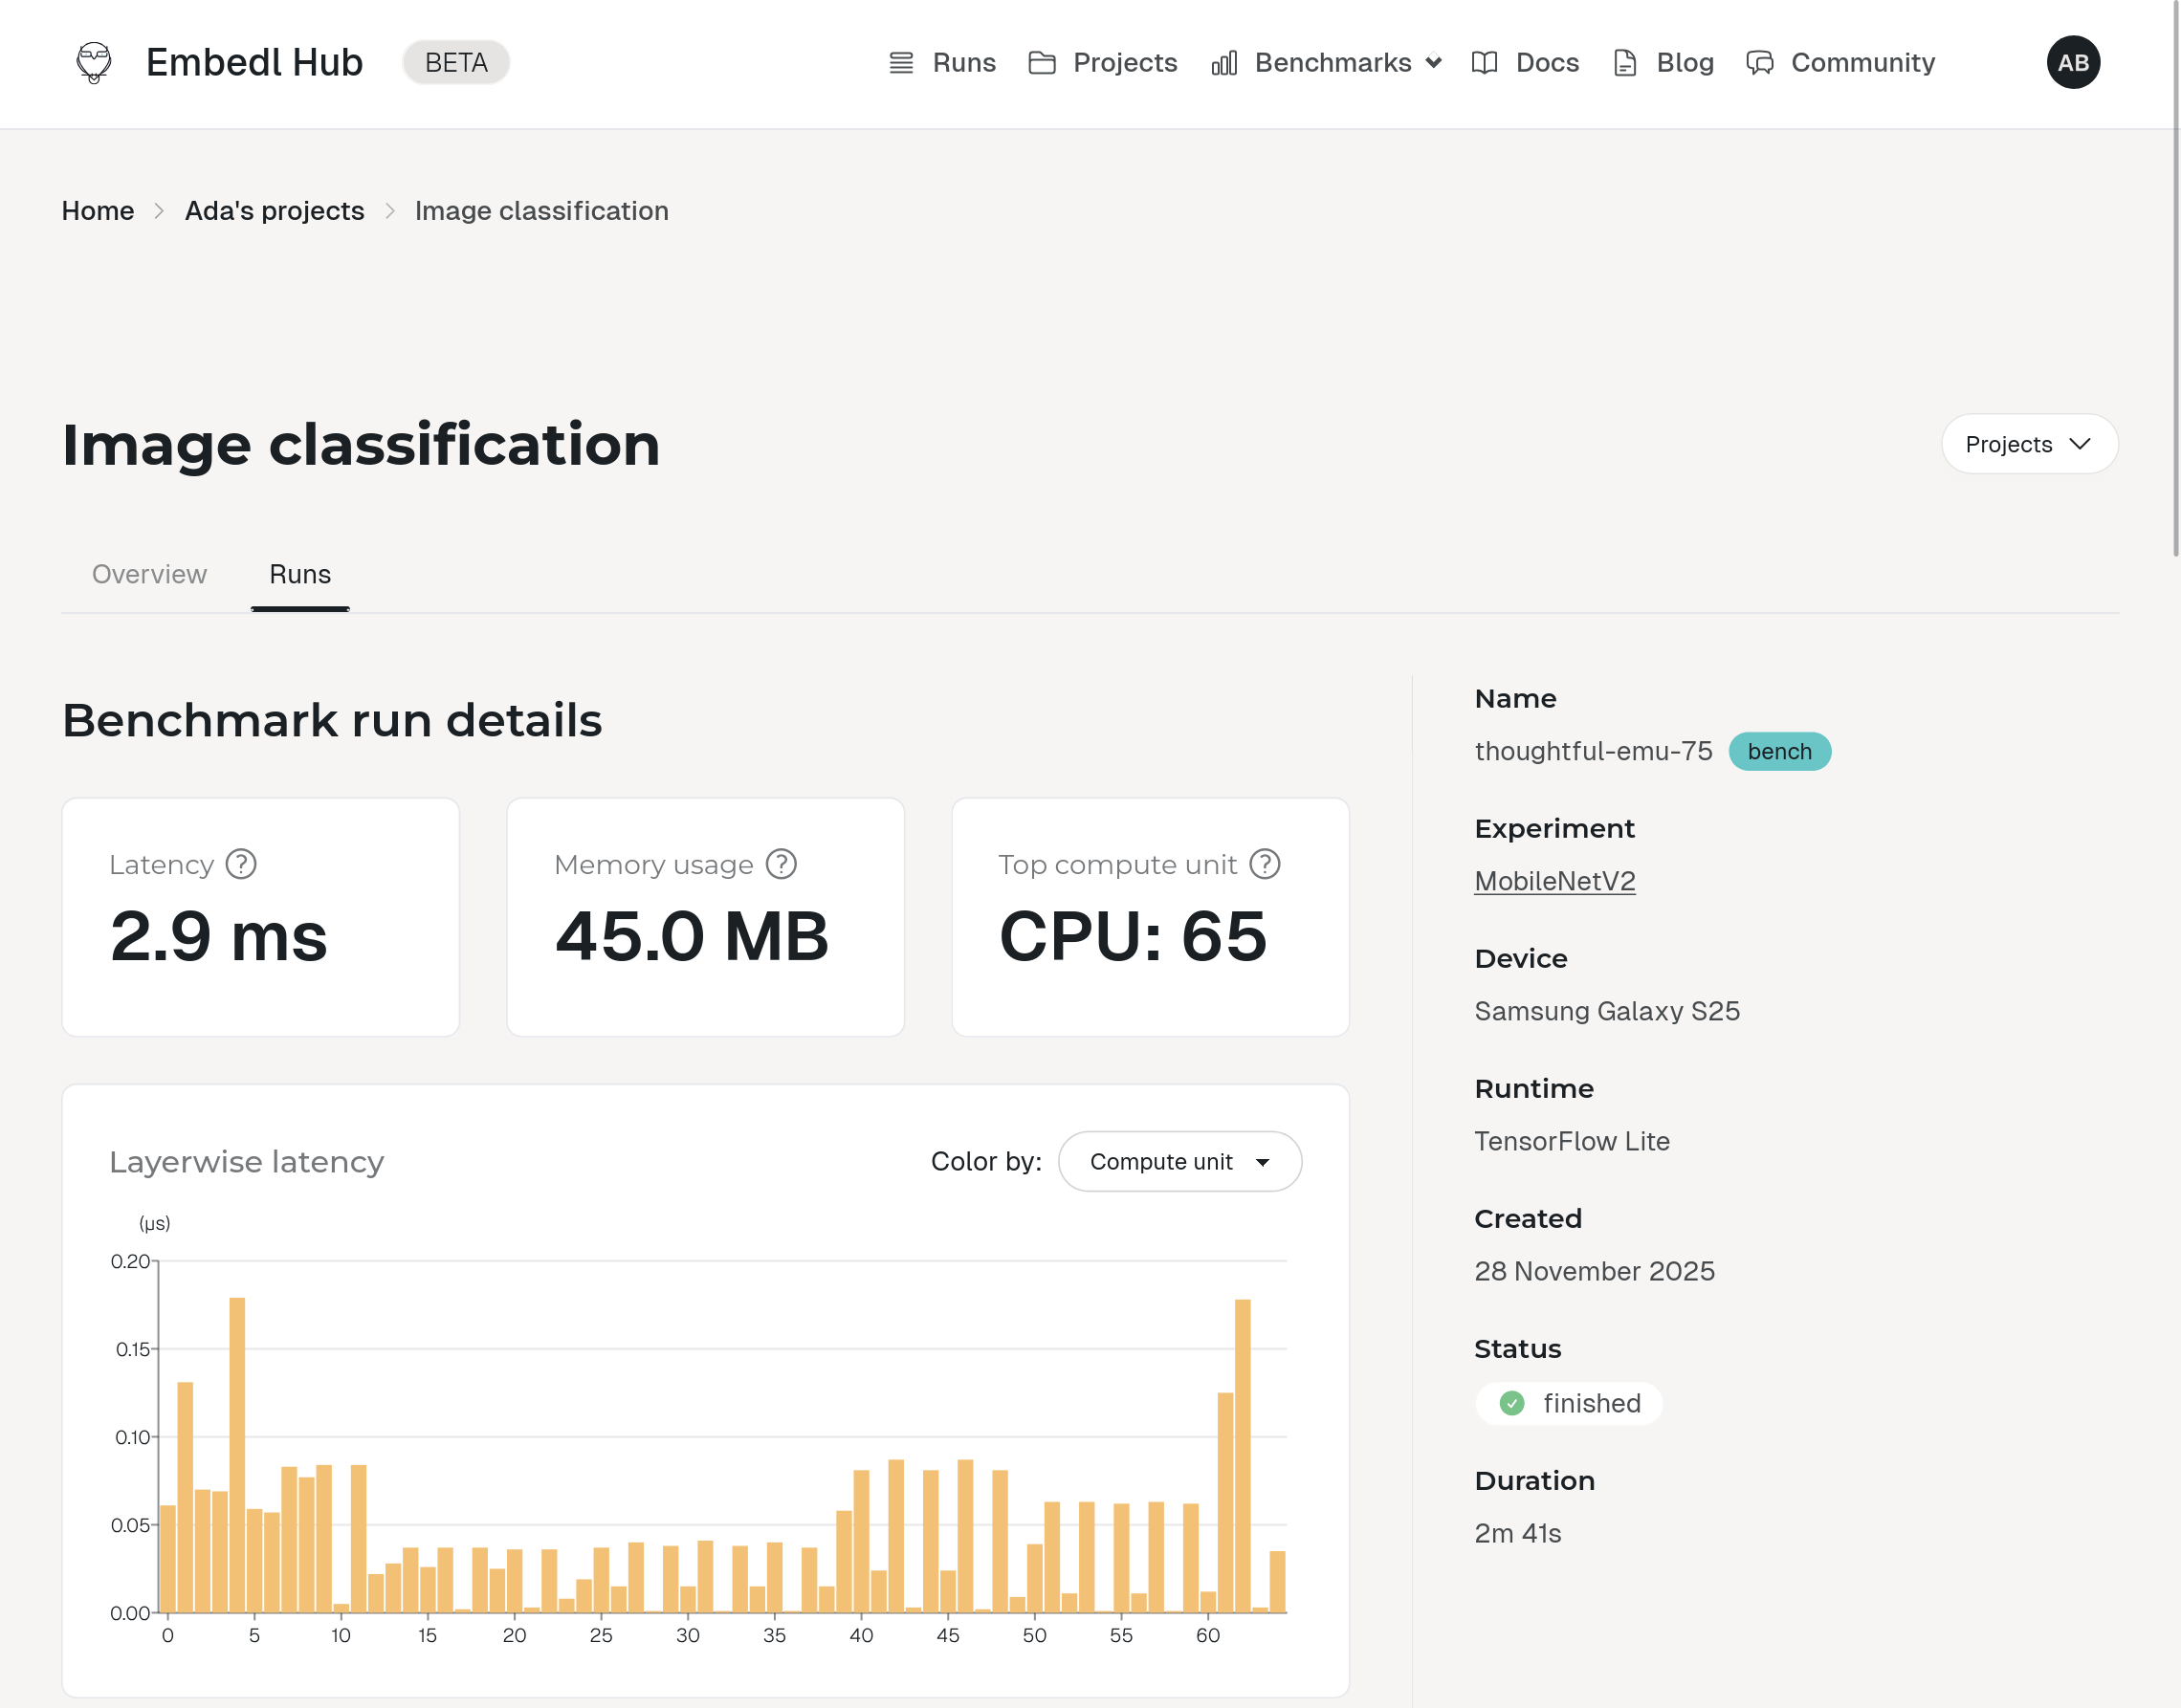
After a profiling run completes, open the run details page from the link printed in the CLI output or from your project’s page on the Hub.
Summary metrics
The top of the page shows three headline numbers:
- Latency — the average time for a single inference on the target device, in milliseconds (ms).
- Memory usage — peak memory consumption during inference, in megabytes (MB).
- Top compute unit — the compute unit (CPU, GPU, or NPU) that executed the most layers.
Layerwise latency
The layerwise latency chart breaks down latency by individual layer in topological order, showing where time is spent across the model.
Hover over a bar to see the layer name and latency. Click a bar to highlight the corresponding row in the model summary table below.
Operation type breakdown
The operation type pie chart has two modes:
- Latency — total latency contributed by each operation type.
- Layer count — number of layers of each type.
Compute units
A breakdown of the number of layers executed on each compute unit (CPU, GPU, NPU). This helps you understand how effectively the model leverages the available hardware — for example, whether compute-heavy layers are running on the NPU or falling back to the CPU.